
Past performance is no guarantee for the future. Because this product is not protected against future market performance, you may lose all or part of your investment.
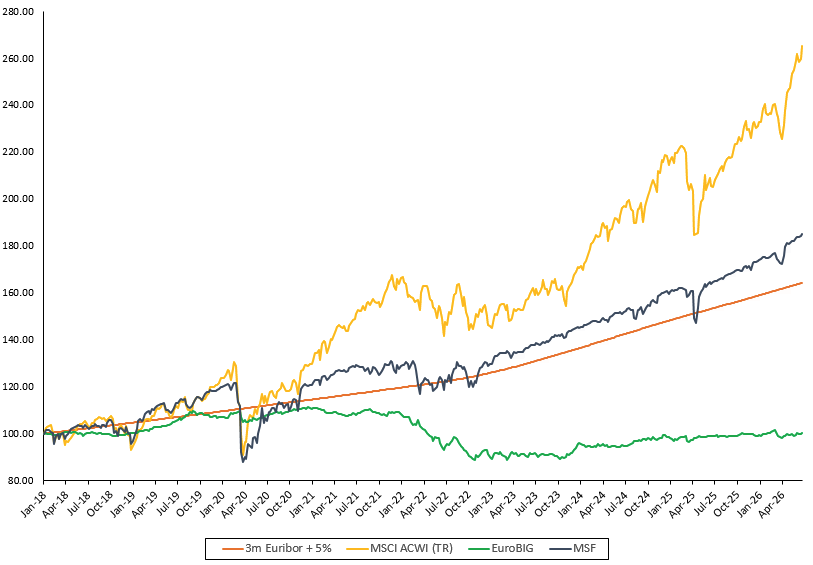
The table below shows the price development of the Market Stability Fund. To put the Market Stability Fund's price development into perspective, the indexed price developments of the 3-month Euribor + 5%, the MSCI ACWI index (including net dividends) and the Euro Broad Investment Grade Bond index are also shown.
Below are links to our Factsheets, NAV history and Performance scenarios.
Every month, our Factsheet discusses our price development, performance and the fund's investment portfolio.
NAV HistoryThe attached file shows Market Stability Fund's historical prices as of the end of the week and the end of the month as of the next business day since 1 January 2018.
Performance ScenariosResults: monthly calculations of the performance scenarios based on statutory calculation rules from Delegated Regulation (EU) 2021/2268
The fund was established on 1 January 2018 and is a mutual fund under Dutch law. The Market Stability Fund Foundation is the legal owner of the fund's assets. Management is carried out by MSF Asset Management B.V.